
1344 Results found.


New NCQA scoring – what health plans should know
Starting in 2020, a systemic shift will change the way health plans prepare for, and are scored, during National Committee for Quality Assurance (NCQA) accreditation. With the focus on quality of care, this transition means keeping up with new requirements is important now more than ever.
DC and Kentucky Medicaid Managed Care RFPs
This week, our In Focus section reviews two Medicaid managed care requests for proposals (RFPs) released on January 10, 2020. The District of Columbia Department of Health Care Finance (DHCF) issued an RFP for the DC Healthy Families Program (DCHFP); the District of Columbia Healthcare Alliance Program (Alliance); and the Immigrant Children鈥檚 Program (ICP) as part of a broader effort to fully transition Medicaid to managed care over the next five years. The new contracts will cover approximately 224,000 lives. Meanwhile, the Kentucky Cabinet for Health and Family Services (CHFS), Department for Medicaid Services (DMS) released a statewide Medicaid managed care RFP to serve approximately 1.2 million lives. In December 2019, Kentucky announced that it will cancel and rebid the current Medicaid managed care contracts.
Texas STAR Kids 鈥� Dallas Service Area RFP
This week, our In Focus section reviews the Texas STAR Kids Medicaid Managed Care in the Dallas Service Area (SA) request for proposals (RFP) released by the Texas Health and Human Services Commission (HHSC) on December 13, 2019. The RFP comes after Children鈥檚 Medical Center, which covers approximately 9,000 members under the program, said it would be leaving the market. The contracts for the SA are worth approximately $500 million. Anthem/Amerigroup will remain in the Dallas SA and continue to provide services. STAR Kids provides Medicaid coverage to individuals with disabilities under age 21.

Midwest Health Plan Earns NCQA Accreditation
THE CLIENT
A managed care health system serving the comprehensive needs of communities and offering care delivery sites across the Midwest.
THE CHALLENGE
The client wanted to expand its reach by offering its Marketplace product in in a nearby state. T he state requires either National Committee for Quality Assurance (NCQA) accreditation or Centers for Medicare and Medicaid Services (CMS) approval to determine network adequacy and allow plans to operate in the state. The client, already established with 红领巾瓜报 in other states, reached out to secure our services to help them with the accreditation process.
While NCQA accreditation is never easy, this process was complicated by several factors including a six-month timeline in order to start processing requests during the open enrollment period, as well as a complex company structure.
APPROACH
Working on-site, 红领巾瓜报鈥檚 experts assembled a team from the client鈥檚 staff to assist with the accreditation process and completed a second-level review of every document as they readied the accreditation submission. After submission, 红领巾瓜报 consultants helped the team answer two rounds of complex questions in response to requests from NCQA.
The biggest challenges were questions regarding the company鈥檚 organizational structure because the plan operates under different names in different states. Multiple-state accreditation is a challenge to explain to NCQA, but 红领巾瓜报鈥檚 seasoned experts were able to create a very clear document and explanation that showed the organizational structure and sole ownership of the health plan. This was crucial because it was a non-typical issue and questions needed to be answered in a satisfactory manner in order to ensure accreditation and the ability to sell the plan鈥檚 product during open enrollment for 2020.
In addition, in order to ensure the accreditation was secured in time, our team was able to obtain an expedited decision from NCQA. Preparing for accreditation is usually a year-long process, but the team was able to complete the process and secure accreditation in less than six months.
RESULTS
The client was granted interim accreditation status on November 15, 2019, in time for the plan to enter the marketplace for open enrollment. Coming up just two points short of a perfect score, the plan reached its goal of opening services in the state.
In addition to helping the client reach its goal, 红领巾瓜报 experts continue to work with the company to tailor and implement a Survey Ready Model to ensure they are prepared for the next accreditation cycle. 红领巾瓜报 also is providing accreditation services to the client in two additional states.
The company president and chief executive officer said accreditation would not have been possible without 红领巾瓜报鈥檚 expertise and guidance.
West Virginia releases Medicaid managed care RFP
This week, our In Focus section reviews the West Virginia Mountain Health Trust request for proposals (RFP) released by the West Virginia Department of Administration (DOA) for the Department for Health and Human Resources (DHHR) on December 17, 2019. Mountain Health Trust (MHT) is the statewide physical and behavioral Medicaid managed care program. West Virginia will award contracts, worth over $1.5 billion, to three managed care organizations (MCOs), with implementation beginning July 1, 2020.

Hospital Charges and Reimbursement for Medicines: Analysis of Cost-to-Charge Ratios
This report is an update to a previous report examining hospital markups for separately paid drugs. Our prior analysis examined hospital charges and reimbursement for 20 drugs and found that hospitals marked up charges for those drugs, on average, 487 percent of their acquisition cost. We also found that hospitals receive 252 percent of estimated hospital acquisition cost from commercial payers. Hospital reimbursement data was obtained from the Magellan Rx Management Medical Pharmacy Trend Report™: 2016 Seventh Edition (the Magellan report) and charges were calculated from Medicare claims data. For more information, please refer to our prior analysis.
Medicaid Managed Care Spending in 2017
This week, our In Focus section reviews Medicaid spending data collected in the annual CMS-64 Medicaid expenditure report. After submitting a freedom of information act request to CMS, we have received a draft version of the CMS-64 report that is based on preliminary estimates of Medicaid spending by state for federal fiscal year (FFY) 2017.脗 The final version of the report will be completed by the end of 2018 and posted to the CMS website at that time.脗 Based on the preliminary estimates, Medicaid expenditures on medical services across all 50 states and 6 territories in FFY 2017 exceeded $571 billion, with over half of all spending now flowing through Medicaid managed care programs. In addition, total Medicaid spending on administrative services was $27.8 billion, bringing total program expenditures to just under $600 billion.
Total Medicaid Managed Care Spending
Total Medicaid managed care spending (including the federal and state share) in FFY 2017 across all 50 states and 6 territories was $297 billion, up from $271 billion in FFY 2016. This figure includes spending on comprehensive risk-based managed care programs as well as prepaid inpatient health plans (PIHPs) and prepaid ambulatory health plans (PAHPs). PIHPs and PAHPs refer to non-comprehensive prepaid health plans that provide only certain services, such as dental services or behavioral health care. Fee-based programs such as primary care case management (PCCM) models are also counted in this total. However, comprehensive risk-based managed care organizations (MCOs) account for 95 percent of the total. Below we highlight some key observations:
- Total Medicaid managed care spending grew 9.5 percent in FFY 2017, the lowest year-over-year growth rate since at least FFY 2007.
- This slowing of spending growth, down from a peak of 31.4 percent in FFY 2015, is due in large part to fewer states expanding Medicaid under the Affordable Care Act (ACA).
- In dollar terms, the increase from FFY 2016 to FFY 2017 was $25.8 billion compared to $32.7 billion from FFY 2015 to FFY 2016.
- Medicaid managed care spending has increased at a 16.9 percent compounded annual growth rate (CAGR) since FFY 2007, compared to 6.1 percent growth in total Medicaid spending.
- Medicaid managed care spending represented 51.9 percent of total Medicaid spending in FFY 2017, exceeding half of total Medicaid medical services expenditures for the first time. Compared to FFY 2016, the penetration rate increased by 2.8 percentage points, the smallest annual increase since FFY 2011.
Medicaid MCO Expenditures as a Percentage of Total Medicaid Expenditures FFY 2007-2017 ($M)

Source: CMS-64
The data breaks down the state and federal share of Medicaid expenditures, which illustrates the impact that the Medicaid expansion, which was initially 100 percent federally funded in the states where it was implemented, has had on the sources of funding.
As the table below indicates, 61.6 percent of FFY 2017 spending was contributed by federal sources, which is 4.2 percentage points higher than the pre-Medicaid expansion share in FFY 2013, but 1.6 percentage points lower than FFY 2016 due to the matching rate reduction for Medicaid expansion enrollees from 100 percent to 95 percent.
Federal vs. States Share of Medicaid Expenditures, FFY 2012-2017

Source: CMS-64
State-specific Growth Trends
Forty-five states and territories report MCO spending on the CMS-64 report of which five states (Alabama, Idaho, North Carolina, Oklahoma and North Dakota) utilize a PCCM and/or PIHP/PAHP model exclusively. Of the remaining 40 states and territories that contract with risk-based MCOs, average spending in FFY 2017 increased 10.3 percent. On a percentage basis, Iowa experienced the highest year-over-year growth in Medicaid managed care spending for the second consecutive year at 88 percent, which was attributable to the continuing roll-out of its managed care program that began in April 2016. Louisiana, Nebraska and New York all saw Medicaid managed care spending growth of more than 40 percent.
The chart below provides additional detail on Medicaid managed care spending growth in states with risk-based managed care programs in FFY 2017. Interestingly, six states reported year over year declines in spending compared to two in FFY 2016.
Medicaid Managed Care Spending Growth on a Percentage Basis by State FFY 2016-17
Click to view graph脗 in April 11, 2018 Weekly Roundup
Source: CMS-64
*Note: Not all states are included in the table due to incomplete data sets
Looking at year-over-year spending growth in dollar terms, New York experienced the largest increase in Medicaid managed care spending by far at over $13 billion.脗 Other states with significant year-over-year spending increases in dollar terms included Lousiana ($2.6 billion), California ($2.2 billion) and Texas ($2.0 billion). All other states saw year-over-year spending growth of less than $2 billion. The chart below illustrates the year over year change in spending across the twenty states with the greatest increases.
Medicaid Managed Care Spending Growth on a Dollar Basis by State (Top Twenty States) FFY 2016-17 ($M)

Source: CMS-64
The percentage of Medicaid expenditures directed through risk-based Medicaid MCOs increased by more than 5 percentage points in eight states from FFY 2016 to FFY 2017. The managed care spending penetration rate rose 16.3 percentage points in Nebraska, and 12.5 percentage points in Louisiana.
Medicaid MCO Expenditures as a Percentage of Total Medicaid Expenditures in States with a 5 percent or Greater Increase From FFY 2016 to FFY 2017 ($M)

Source: CMS-64
The table below ranks the 40 states with risk-based comprehensive Medicaid managed care programs by the percentage of total Medicaid spending that is through Medicaid MCOs. Puerto Rico reported the highest such percentage at 98.6 percent, followed by Hawaii at 94.7 percent and Kansas at 93.5 percent. Iowa is fourth on the list having increased its Medicaid managed care spending penetration rate from 13.4% to 92.2% over the last two years.
We note that in many states, there are certain payment mechanisms which may never be directed through managed care such as supplemental funding sources for institutional providers and spending on retroactively eligible beneficiaries. Thus, the maximum achievable penetration rate in each state will vary and may be below that achieved in other states. Nevertheless, we note that there are a few large states where the penetration rates are currently below two-thirds of total spending but where they have expanded their Medicaid managed care programs recently including Pennsylvania and Virginia. Accordingly, we expect that in FFY 2017 we will see continued growth in Medicaid MCO penetration, though likely at a more moderate pace.
Medicaid MCO Expenditures as a Percent of Total Medicaid Expenditures, FFY 2015-2017

Source: CMS-64
Non-MCO Expenditures
Despite the rapid growth in Medicaid managed care over the last ten years, program spending still represented just over half of total Medicaid expenditures in FFY 2017. So where is the remaining FFS spending (approximately $275 billion) going? First, as noted above, there are many states/territories with Medicaid managed care programs where certain beneficiaries or services are carved-out of the program, and these are typically associated with high-cost populations. The total amount of non-MCO spending in these 40 states in FFY 2017 was around $235 billion. If we were to assume for the sake of argument that 芒鈧揻ull penetration芒鈧� was 85 percent of total Medicaid spending, then we estimate that an additional $200 billion in current FFS spending could shift to a managed care model just in the states that already employ managed care for a subset of services and/or beneficiaries.
Next, there are 16 states/territories that did not utilize a comprehensive risk-based managed care model in FFY 2017. One of these states, North Carolina, is planning to implement such a model in the next several years. In general, the 16 states/territories that do not utilize managed care today are smaller states, North Carolina being the largest at $13 billion of Medicaid spending in FFY 2017. Total Medicaid spending across all 16 non-managed care states was $34.7 billion. The 16 states/territories that did not employ a risk-based comprehensive Medicaid managed care model in FFY 2017 were Alabama, Alaska, American Samoa, Arkansas, Connecticut, Guam, Idaho, Maine, Montana, Northern Mariana Islands, North Dakota, North Carolina, Oklahoma, South Dakota, Vermont and Virgin Islands.
In terms of spending by service line, the largest remaining fee-for-service (FFS) category is inpatient services, at $61 billion or 22.4 percent of FFS spending. This amount is split fairly evenly between regular FFS payments (53 percent of total) and supplemental/Disproporate Share Hospital (DSH) payments (47 percent). Measured as a whole, however, we estimate long term care services and supports (including nursing facility, waiver and other home and community based services) represent the largest FFS funding category.
Fee for Service Medicaid Expenditures by Service Line, FFY 2017

Source: CMS-64
Finally, we note that while the CMS-64 report provides valuable detail by service line for all FFS expenditures, it does not capture how spending directed to Medicaid MCOs is allocated by category of service. As such, it is not possible to calculate total spending by service line, a challenge that will only intensify as more spending runs through MCOs.
Michigan Medicaid Managed Care Results Announced
In previous editions of The Michigan Update (most recently in August) we have reported on the Michigan Department of Health and Human Services鈥� (MDHHS) release of a Request for Proposals (RFP) to re-procure its Medicaid managed care contracts. The RFP was released in early May with bidder responses due in early August. This procurement is for at least five years, with the possibility of up to three one-year extensions. The total cost of the procurement for five years is estimated to be $35 billion. On October 13, 2015 the State of Michigan announced the much anticipated results of the re-procurement.
Since the prices paid to the contracted HMOs are set by the state, the health plan selection was based solely on technical scores. The HMOs were required to bid on entire regions, which were configured differently than in the past. The reconfiguration required a number of the HMOs to expand their service areas to meet the 鈥渆ntire region鈥� requirement. The new regional configuration appears in the map below:
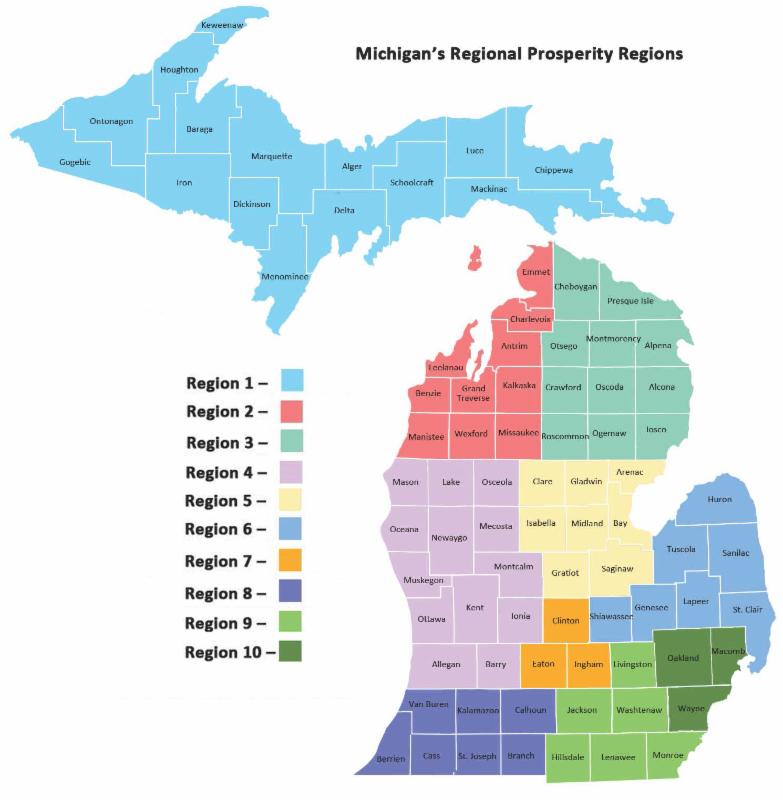
Note: Region 2 and Region 3 were required to be bid together.
The RFP included a proposed number of HMOs that would be awarded contracts for each of these regions. To minimize disruptions for Medicaid enrollees, in each region (other than the Upper Peninsula) the number of plans selected was one more than the proposed maximum number of awards for that region. Proposals from the HMOs were evaluated based on demonstrated competencies and also statements of their proposed approaches to many new initiatives related to population health, care management, behavioral health integration, patient-centered medical homes, health information technology and payment reform.
Not every HMO was successful in each region for which it submitted a bid. Two plans were not successful in any region. One is Sparrow PHP, which is an incumbent plan in Region 7. The other is MI Complete Health (Centene/Fidelis SecureCare) which is not currently a Medicaid plan in any part of the state but does have an Integrated Care Organization contract to serve dual Medicare/Medicaid enrollees in Macomb and Wayne counties as part of Michigan鈥檚 dual eligible demonstration.
The following table indicates the regions for which each bidding HMO was and was not successful. In addition, the numerical values show the rank of that plan based on their evaluation scores among the successful bidders for each region. If an HMO is a current contractor for all counties in a region, their result is shaded green. If the HMO is a current contractor for some but not all counties in a region, their result is shaded yellow. The number of Medicaid enrollees currently served in each of the regions, eligible through both 鈥渢raditional鈥� Medicaid and the Healthy Michigan Plan, appear in the bottom row on the table; across all regions, this is more than 1.6 million Medicaid enrollees.
Technical Evaluation Results
|
|
Region 1
|
Region 2
|
Region 3
|
Region 4
|
Region 5
|
Region 6
| Region 6 |
Region 8
|
Region 9
|
Region 10
|
|
Aetna Better Health
(CoventryCares)
|
|
|
|
|
No
|
|
|
Yes – 4
|
Yes – 4
|
Yes – 7
|
|
Blue Cross Complete
|
|
|
|
Yes – 3
|
|
Yes – 5
|
Yes – 3
|
|
Yes – 3
|
Yes – 5
|
|
HAP Midwest Health Plan
|
|
|
|
|
|
Yes – 6
|
|
|
No
|
No
|
|
Harbor Health
Plan
|
|
|
|
|
|
|
|
|
|
Yes – 8
|
|
McLaren Health
Plan
|
|
Yes – 3
|
Yes – 3
|
Yes – 4
|
Yes – 3
|
Yes – 3
|
Yes – 2
|
Yes – 3
|
Yes – 6
|
Yes – 4
|
|
Meridian Health Plan of MI
|
|
Yes – 1
|
Yes – 4
|
Yes – 5
|
Yes – 2
|
Yes – 4
|
No
|
Yes – 5
|
Yes – 5
|
Yes – 3
|
|
MI Complete Health
(Centene/Fidelis)
|
|
|
|
|
|
|
|
|
No
|
No
|
|
Molina Healthcare
of MI
|
|
Yes – 4
|
Yes – 1
|
Yes – 1
|
Yes – 1
|
Yes – 2
|
Yes – 1
|
Yes – 1
|
Yes – 1
|
Yes – 2
|
|
Priority Health Choice
|
|
No
|
No
|